
It can be difficult to compare how different countries tax their residents. Tax laws are some of the most complex regulations in the world. In this post, we will seek to compare the income tax liability for earners in different countries. Note that this does not account for the full tax burden residents may bear from corporate income taxes, import tariffs, consumption taxes and other additional taxes a government may levy.
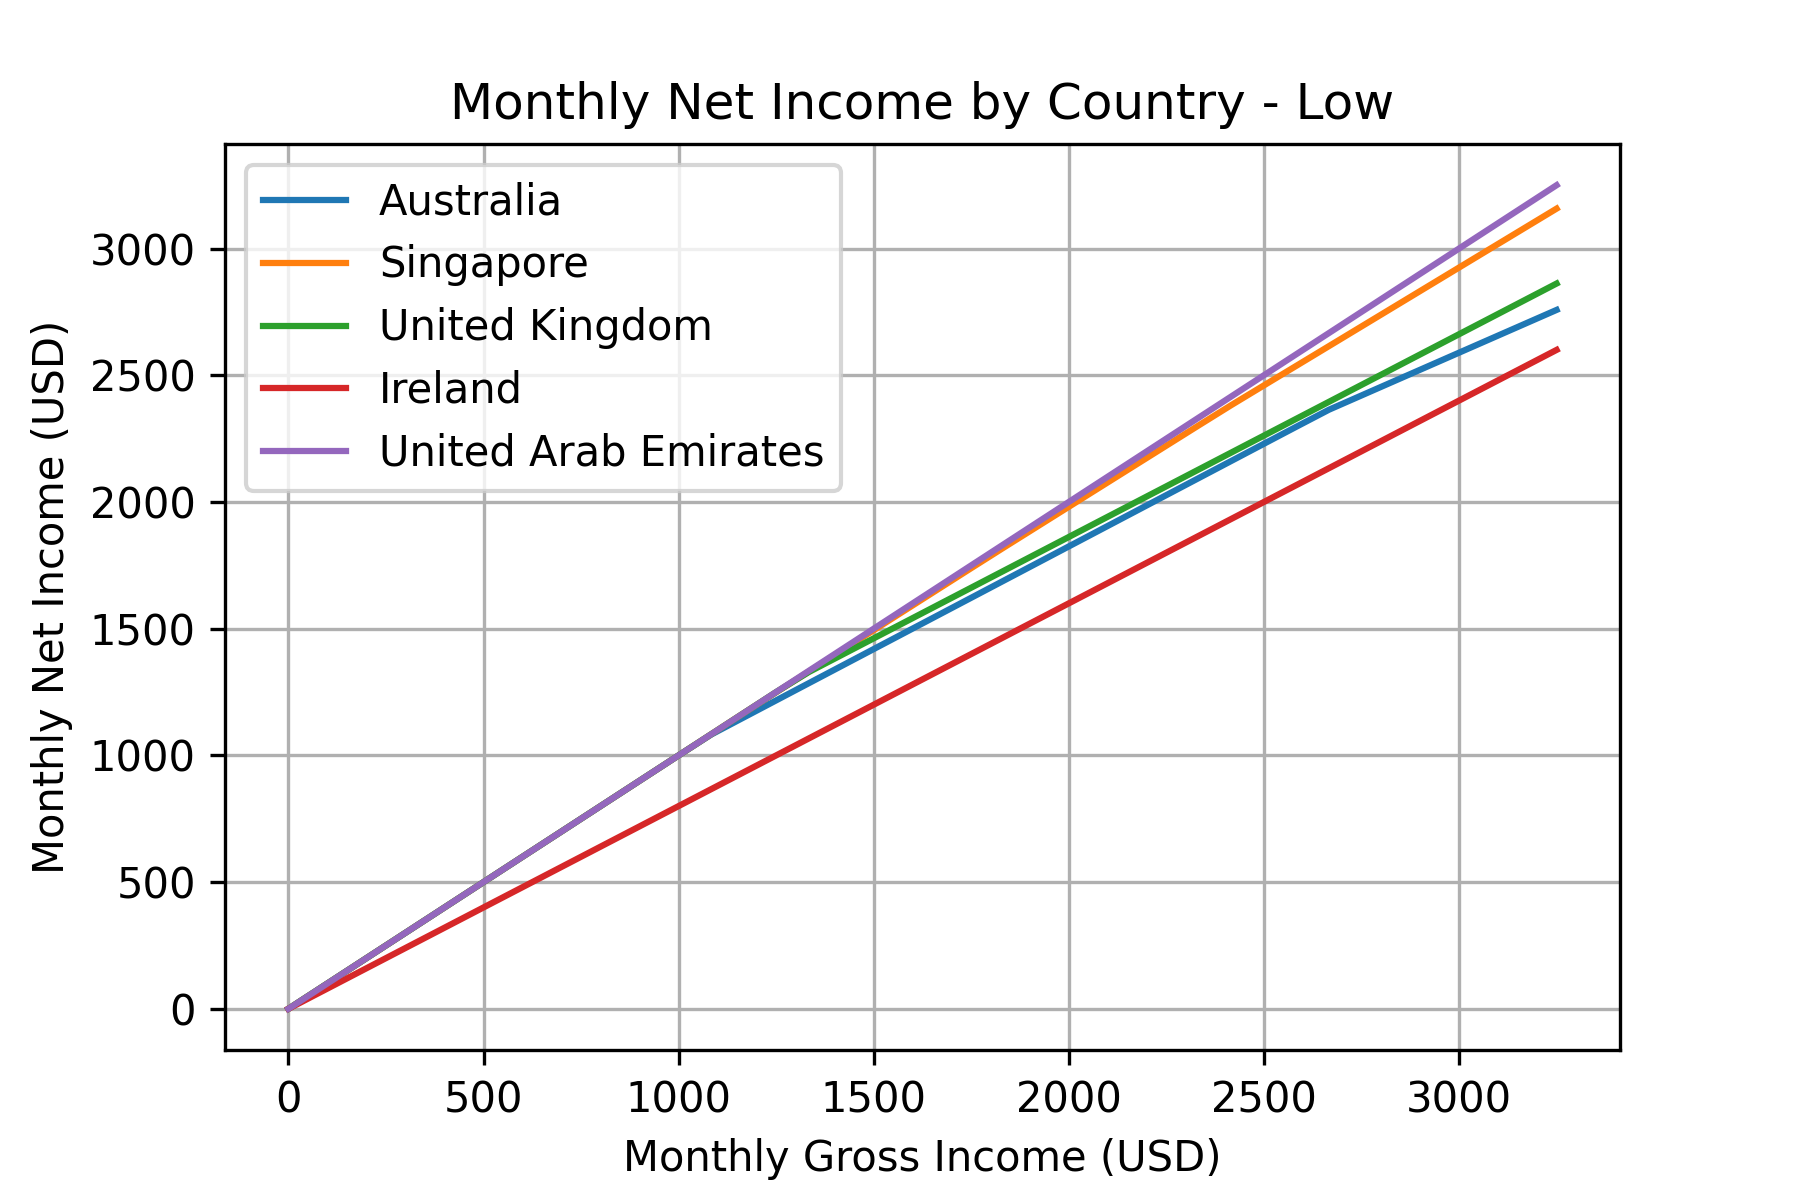
The following plots show the estimated take home income (USD), per month for single residents assuming income is pro-rated over the year. This is not tax advice and no guarantee is made for its accuracy, individual situations will likely differ - contact a local accountant for tax advice.
Code
from numpy import ndarray, vectorize

class TaxCalculator:
    #rates are in local currency for the region, for 2021-2022
    # https://www.ato.gov.au/rates/individual-income-tax-rates/
    aus_rates = {0: 0, 18200:.19, 45000:.325, 120000:.37, 180000:.45}
    # https://www.iras.gov.sg/taxes/individual-income-tax
    sg_rates = {0: 0, 20000:.02, 30000:.035, 40000:.07, 80000:.115,
                120000:.15, 160000:.18, 200000:.19, 240000:.195, 280000:.2,
                320000:.22}
    # https://www.gov.uk/income-tax-rates
    uk_rates = {0:0, 12570:.2, 50270:.4, 150000:.45}
    # https://taxsummaries.pwc.com/united-arab-emirates/individual/taxes-on-personal-income
    uae_rates = {0:0}
    # https://taxsummaries.pwc.com/ireland/individual/taxes-on-personal-income
    ire_rates = {0:.2, 36800:0.4}

    tax_rates_of = {"Australia":aus_rates,
                    "Singapore":sg_rates,
                    "United Kingdom":uk_rates,
                    "United Arab Emirates":uae_rates,
                    "Ireland":ire_rates}

    # google on 10/6/22
    usd_exchange_rate_of = {"Australia": 0.71,
                            "Singapore": 0.72,
                            "United Kingdom": 1.25,
                            "United Arab Emirates":0.27,
                            "Ireland": 1.06}

    def __init__(self, country):
        self.country = country
        try:
            self.rates = self.tax_rates_of[country]
            self.usd_rate = self.usd_exchange_rate_of[country]
        except KeyError:
            raise Exception("Country not supported!")

    def tax_on_usd_vector(self, income: ndarray):
        return vectorize(self.tax_on_usd)(income)

    def tax_on_usd(self, income: float):
        return self.tax(income/self.usd_rate)*self.usd_rate

    def tax(self, income):

        tax = 0
        while income > 0:
            # find largest bracket which is smaller than income
            largest_bracket = 0
            for bracket in self.rates.keys():
                if bracket >= income:
                    break
                largest_bracket = bracket

            tax += (income-largest_bracket)*self.rates[largest_bracket]
            income = largest_bracket
        return tax
This code shows how the TaxCalculator is used to generate the plots above.
from numpy import arange
from matplotlib import pyplot as plt, rcParams
rcParams['figure.dpi'] = 300

usd_income = arange(0, 40000, 1000)

for country in ["Australia", "Singapore", "United Kingdom",
                "Ireland", "United Arab Emirates"]:
    calculator = TaxCalculator(country)

    tax_usd = calculator.tax_on_usd_vector(usd_income)

    plt.plot(usd_income/12, (usd_income-tax_usd)/12, label=country)

plt.xlabel("Monthly Gross Income (USD)")
plt.ylabel("Monthly Net Income (USD)")
plt.title("Monthly Net Income by Country")
plt.legend()
Those wanting to view the full source code may do so at github.com/lachstr/income-taxes-by-country-plot. A Python 3 installation with numpy and matplotlib should be sufficient to reproduce the plots locally.