Here we will investigate a modified version of the well known 100 passenger plane boarding problem.
Let’s consider the following scenario;
There are 100 passengers about to board a plane.
The first passenger to board sits in someone else’s seat, maliciously - not a random seat.
Each following passenger;
- Sits in their assigned seat if it is available
- Otherwise, randomly chooses an available seat
You are the 100th passenger to board the plane, what is the probability that you are able to sit in your assigned seat?
We could attempt to simulate the event with a function like this;
import numpy as np
import random

## Generalise the scenario for a number of passengers equal to `plane_size`
def last_passenger_sits_in_assigned_seat(plane_size):
    plane = {}

    for seat_number in range(plane_size):
        plane[seat_number] = 'empty'

    passengers = [i for i in range(plane_size)]
    random.shuffle(passengers)

    ## Sit the first passenger in the wrong seat
    while (rand_wrong_seat := random.randint(0, plane_size-1)) == passengers[0]:
        pass
        ## Pick another random seat which isn't the assigned one

    plane[rand_wrong_seat] = 'taken'

    ## Seat the 2nd to 2nd last passengers according to logic above
    for passenger in passengers[1:-1]:
        if plane[passenger] == 'empty':
            ## This passenger can sit in their assigned seat
            plane[passenger] = 'taken'
        else:
            ## Someone is sitting in this passenger's seat,
            ## find a random empty seat for them.
            seats = list(plane.items())
            random.shuffle(seats)
            for seat_number, availability in seats:
                if availability == 'empty':
                    plane[seat_number] = 'taken'
                    break

    ## Check to see if the last passenger has their seat
    if plane[passengers[-1]] == 'empty':
        return True
    else:
        return False
Adding some print statements to the function we can ensure it works correctly.
In[32] last_passenger_sits_in_assigned_seat(plane_size=10)
Passenger 7 sits in seat 5
Passenger with seat 1 sits in their assigned seat
Passenger with seat 9 sits in their assigned seat
Passenger with seat 8 sits in their assigned seat
Passenger with seat 0 sits in their assigned seat
Passenger with seat 3 sits in their assigned seat
Passenger with seat 6 sits in their assigned seat
Passenger with seat 5 sits in seat 4
Passenger with seat 2 sits in their assigned seat
Out[32] False
Great! We’ve simulated a plane boarding event for a 10 passenger plane and found the last passenger was not able to sit in their assigned seat. Calling the function again would likely result in different output.
One interesting question to ask is;
Is the event that the last passenger sits in their assigned seat independent of the size of the plane?
We could be clever about it and construct a mathematical argument. However, such things are too difficult for the computer scientist. Alas, we shall simulate such events. This has the advantage of being applicable when the situation is more complicated and a proof cannot be demonstrated.
We will simulate boarding planes of size 10, 30, 60, 100, 150, 200 once on each day of the month, compute the experimental probability that the last passenger was able to sit in their assigned seat that month, then repeat this process for 100 years (1200 months).
resulting_prob = {}

plane_sizes = [10, 30, 60, 100, 150, 200]

for plane_size in plane_sizes:
    resulting_prob[plane_size] = []
    years = 100
    for months in range(12*years):

        able_to_sit_in_assigned_seat = 0

        for day in range(31):
            if (last_passenger_sits_in_assigned_seat(plane_size)):
                able_to_sit_in_assigned_seat += 1

        probability_this_year = able_to_sit_in_assigned_seat/31

        resulting_prob[plane_size].append(probability_this_year)

import pandas

data = pandas.DataFrame(resulting_prob)
print(data)
           10        30        60        100       150       200
0     0.354839  0.580645  0.612903  0.580645  0.483871  0.612903
1     0.612903  0.193548  0.516129  0.516129  0.548387  0.451613
2     0.516129  0.387097  0.483871  0.548387  0.548387  0.548387
3     0.548387  0.612903  0.612903  0.451613  0.387097  0.580645
4     0.483871  0.258065  0.612903  0.387097  0.516129  0.354839
...        ...       ...       ...       ...       ...       ...
1195  0.290323  0.483871  0.483871  0.580645  0.354839  0.451613
1196  0.322581  0.548387  0.419355  0.483871  0.677419  0.516129
1197  0.387097  0.419355  0.387097  0.451613  0.354839  0.483871
1198  0.387097  0.483871  0.516129  0.645161  0.451613  0.483871
1199  0.419355  0.548387  0.451613  0.645161  0.451613  0.387097
The pandas dataframe is a bit difficult to visualise, so we can plot this data on a histogram.
import matplotlib.pyplot as plt

plt.title("100 Years of Plane Boarding")
plt.ylabel('Number of Months with Probability')
plt.xlabel('Probability Final Passenger has Assigned Seat')

from statistics import mean, stdev

for plane_size in plane_sizes:
    plt.hist(data[plane_size], label=f"""{plane_size} seat plane
             μ={mean(data[plane_size]):.3f}
             σ={stdev(data[plane_size]):.3f}""")


plt.legend()
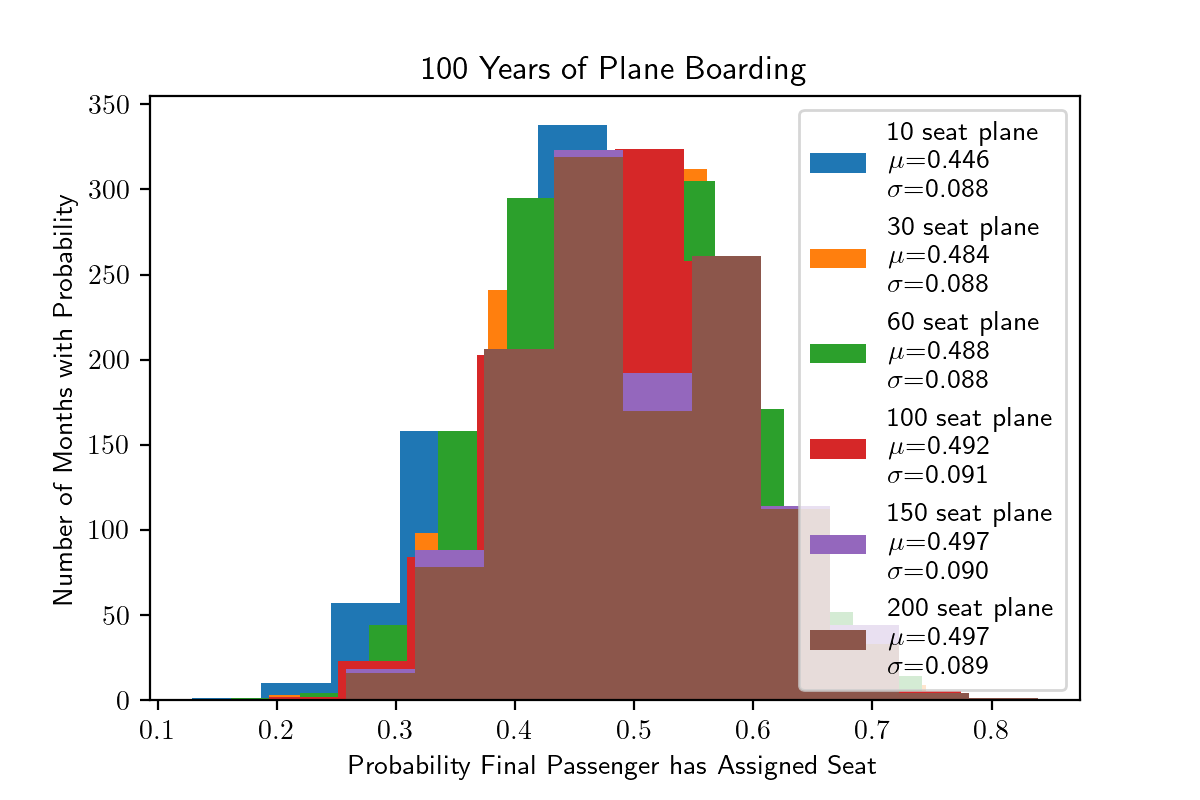
Curiously, we do note that the 10 seat plane has a lower probability than the others. Not so obvious? We can plot the mean probability as a function of plane size.
for plane_size in plane_sizes:
    plt.plot(plane_size, mean(data[plane_size]), '.')

plt.xlabel('Plane Size')
plt.ylabel('Mean Probability Final Passenger has Assigned Seat')
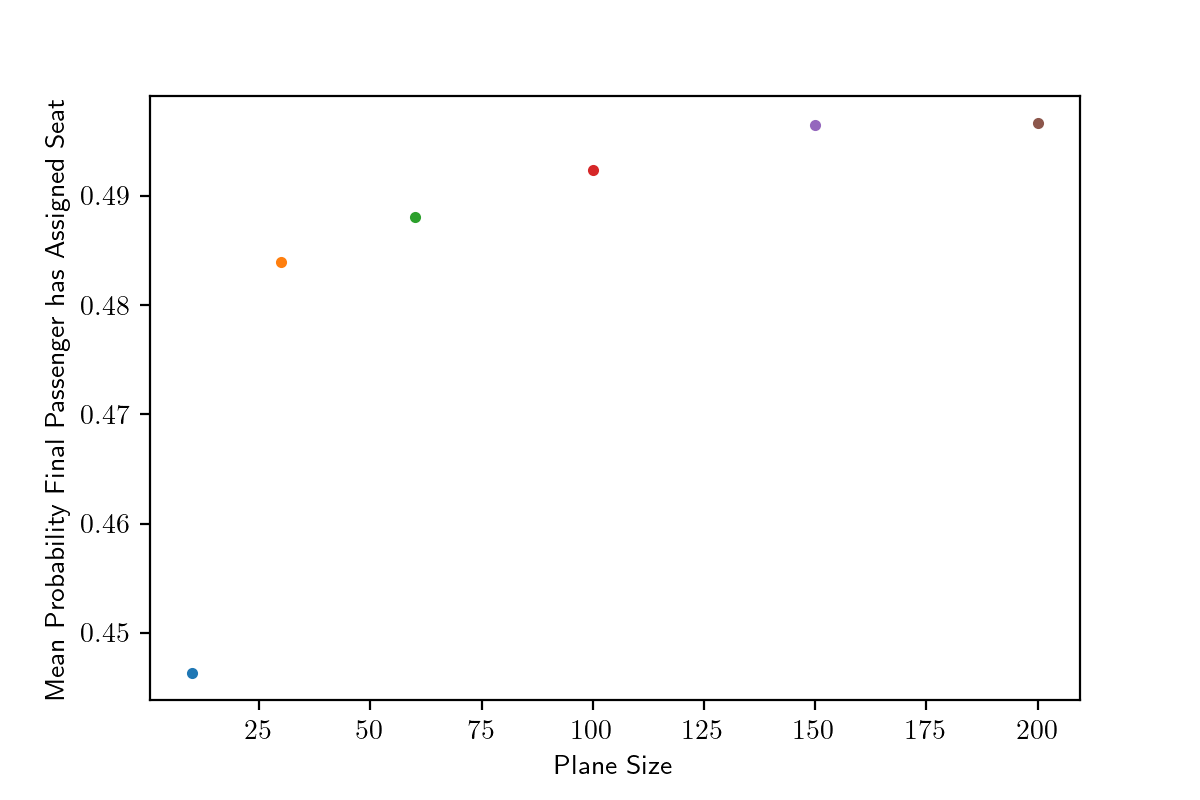
Interesting indeed!
It seems like the probability asymptotes to 0.5 as the plane size increases…
Our data is looking abit scarce, let’s try doing the same experiment for another few hundred years and a larger assortment of plane sizes…
- A larger assortment of plane sizes will make the pattern more obvious to see
- A larger number of years will increase our confidence in the final mean
resulting_prob = {}

plane_sizes = np.arange(10, 120, 5)

for plane_size in plane_sizes:
    resulting_prob[plane_size] = []

    years = 1000
    for months in range(12*years):

        able_to_sit_in_assigned_seat = 0

        for day in range(31):
            if (last_passenger_sits_in_assigned_seat(plane_size)):
                able_to_sit_in_assigned_seat += 1

        probability_this_year = able_to_sit_in_assigned_seat/31

        resulting_prob[plane_size].append(probability_this_year)

data = pandas.DataFrame(resulting_prob)

for plane_size in plane_sizes:
    plt.plot(plane_size, mean(data[plane_size]), '.')

plt.xlabel('Plane Size')
plt.ylabel('Mean Probability Final Passenger has Assigned Seat')
plt.title('A Millennia of Boarding')
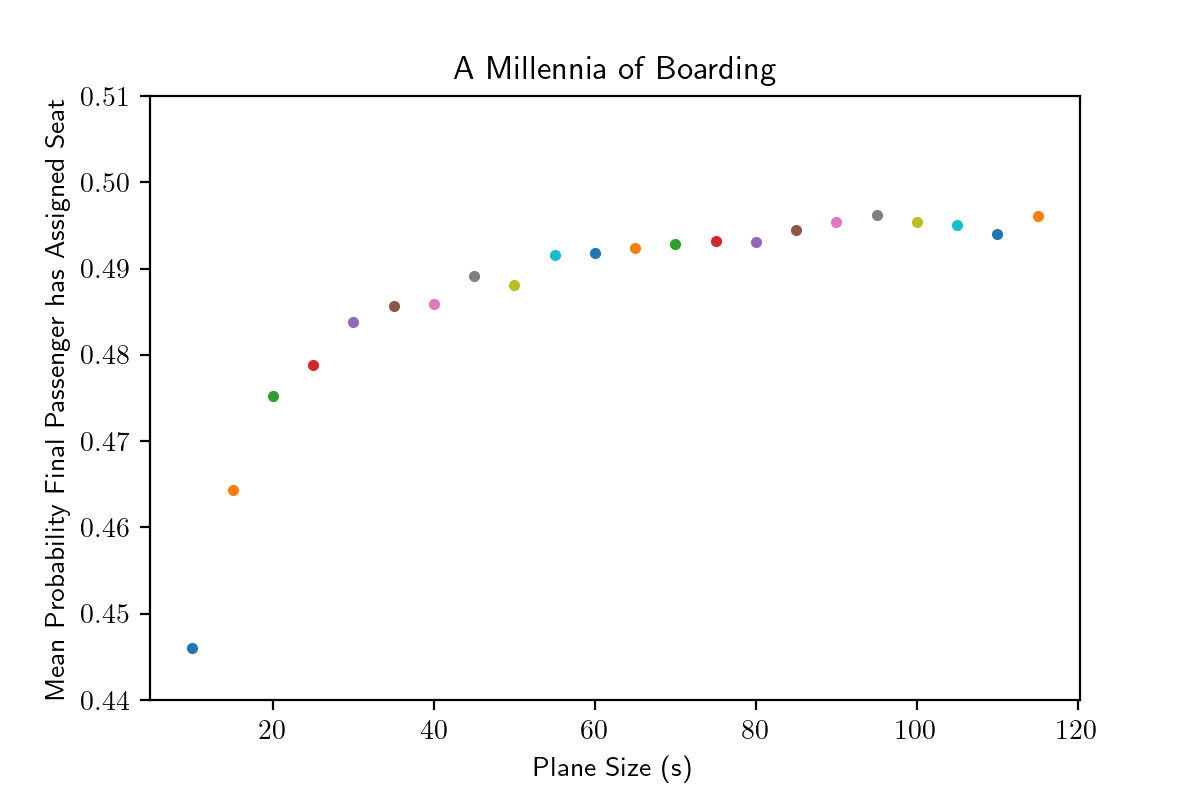
Beautiful!
It seems that this occurs because we have guaranteed the first passenger sits in the wrong seat. This means that the first passenger never sits in the correct seat. This has a decreasing effect on the overall probability as the plane size increases - later we’ll determine precisely what that means.
Instead let’s modify our original function so that the passenger chooses a seat at random (meaning, they may sit in the correct seat.)
This is done by swapping out
## Sit the first passenger in the wrong seat
while (rand_wrong_seat := random.randint(0, plane_size-1)) == passengers[0]:
    pass
    ## Pick another random seat which isn't the assigned
plane[rand_wrong_seat] = 'taken'
with;
## Sit the first passenger in a random seat
rand_seat = random.randint(0, plane_size-1)
plane[rand_seat] = 'taken'
Running the same code that was used to produce the last plot gives
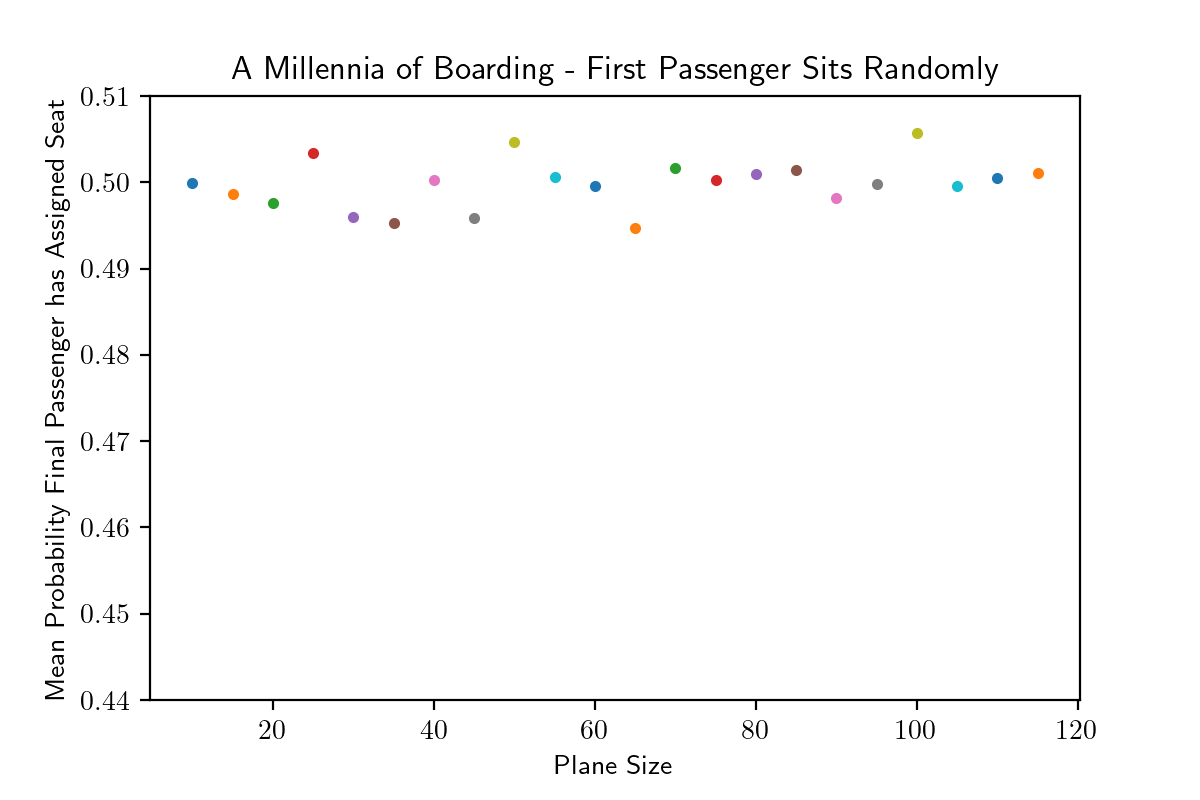
Probabilities seem to cluster around 0.5 independently of the plane size. This is an (intriguing, however) well known result that has been explored elsewhere. It is reassuring that our simulations reflect mathematics!
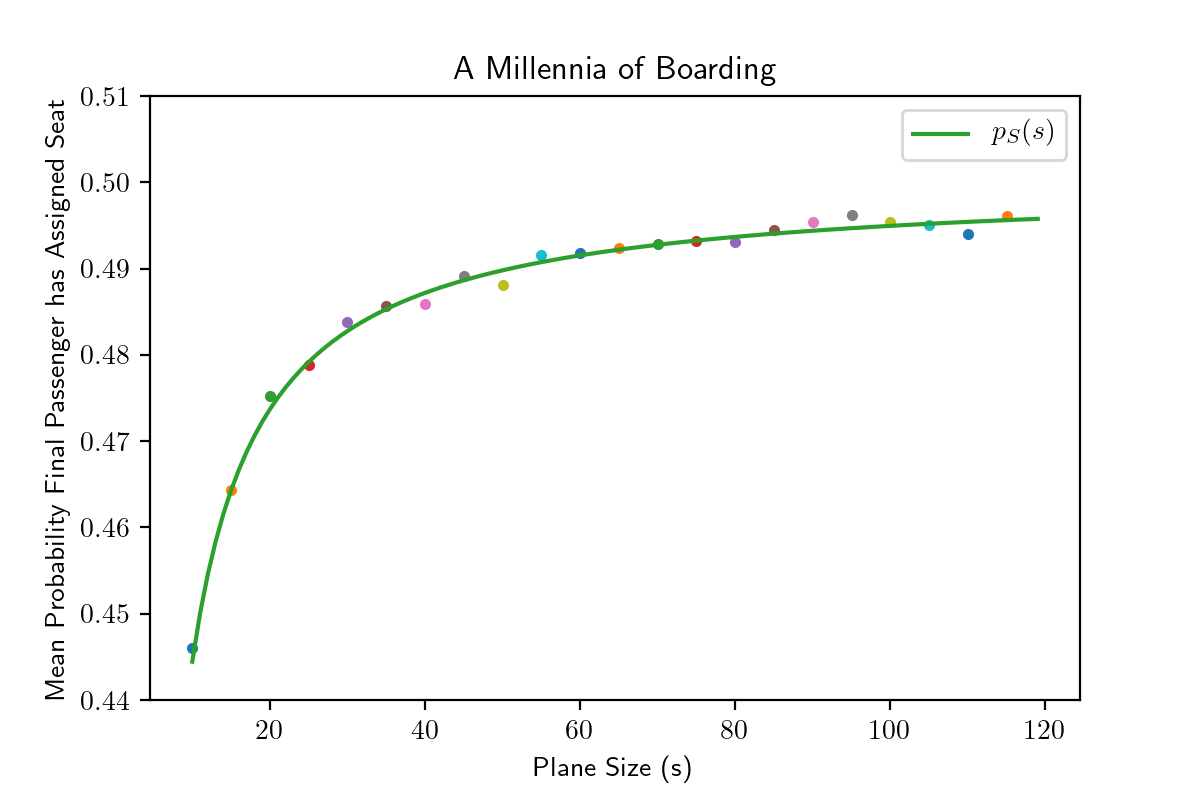
Here we will explore the first situation and see if we can predict the simulation’s results analytically.
For each plane of size , the probability that the final passenger sits in their assigned seat is a the outcome of a Bernoulli trial with probability
where
is given by the function;
Plotting ontop of our simulated data we find excellent agreement.